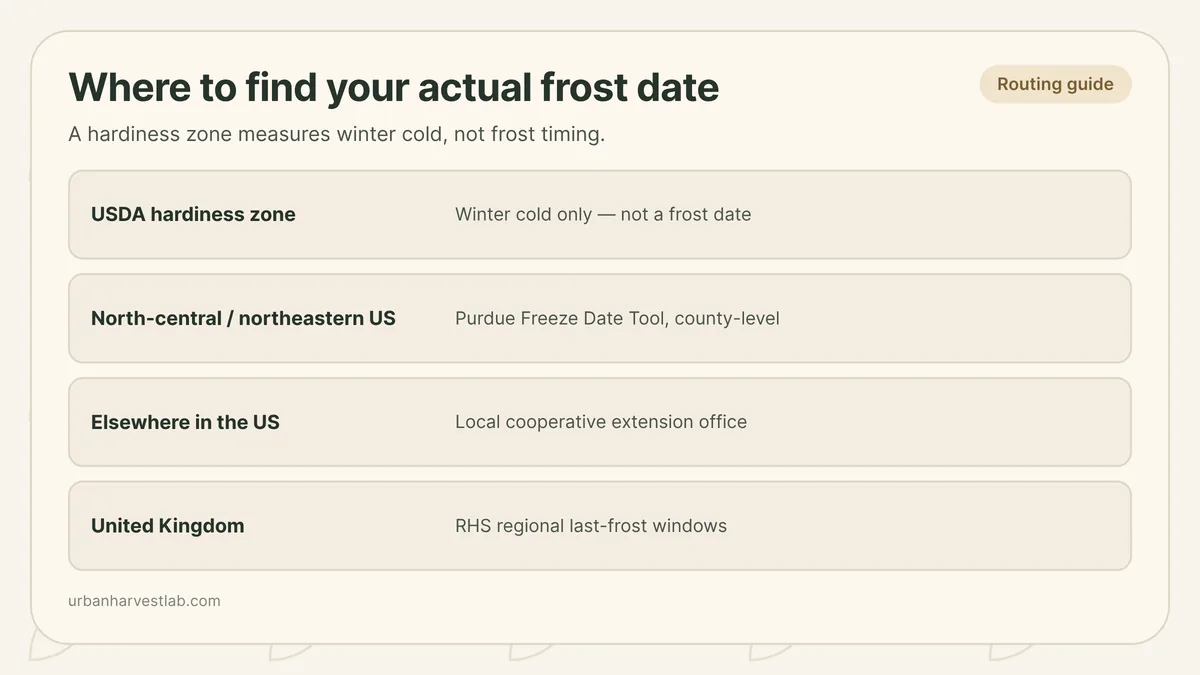
A USDA hardiness zone tells you how cold your winter gets, not when frost starts or stops — those come from two different kinds of weather-station data, and the two are easy to confuse. The actual date comes from a different tool: Purdue’s Freeze Date Tool for the north-central and northeastern United States, a local cooperative extension office everywhere else in the US, and RHS’s regional windows in the UK. Look up your zone below for its real number, then follow the routing to whichever of those applies to you. Once a working date exists, plug it into a full balcony vegetable garden calendar for the rest of the season.
What a hardiness zone actually measures
The USDA Plant Hardiness Zone Map divides the country into 5°F bands built from the average annual extreme minimum winter temperature recorded at weather stations, using a 30-year average (1991-2020 for the current map). Zone 7a covers 0°F to 5°F; zone 8b covers 15°F to 20°F; the scale runs from -60°F to -55°F at zone 1a up to 65-70°F at zone 13b. Nothing in that number is a calendar date. It describes how cold the coldest night of an average winter gets — useful for deciding whether a perennial herb or a container-grown shrub can survive outdoors, not for deciding when to move a seedling tray out onto the railing.
That distinction holds because a zone and a frost date come from different measurements. A zone is built from one extreme value per winter. A frost date is built from tracking how often a station’s temperature crosses a freezing threshold in spring and in autumn — Purdue’s freeze-date tool, covered below, tracks several such thresholds rather than a single one. Two places can share a zone number and still have very different frost windows, because a coastal, maritime station and a continental, inland one can post the same coldest night while their frost-free season in between runs to very different lengths.
Look up your zone’s temperature band
Zone lookup
Select your zone and general region. The result is your zone's temperature band, not a frost date — the routing note points you to the source that actually publishes one.
Average annual minimum
—
- Zone midpoint
- —
- What it tells you
- Winter cold tolerance only
- Next step for your region
- Select a region for a routing note.
Select a zone to see the calculation.
The reference table below is the same lookup without the form, for a quick scan or if scripts are unavailable:
| Zone | Average annual minimum temperature (USDA) |
|---|---|
| 1 (1a/1b) | -60°F to -50°F |
| 2 (2a/2b) | -50°F to -40°F |
| 3 (3a/3b) | -40°F to -30°F |
| 4 (4a/4b) | -30°F to -20°F |
| 5 (5a/5b) | -20°F to -10°F |
| 6 (6a/6b) | -10°F to 0°F |
| 7 (7a/7b) | 0°F to 10°F |
| 8 (8a/8b) | 10°F to 20°F |
| 9 (9a/9b) | 20°F to 30°F |
| 10 (10a/10b) | 30°F to 40°F |
| 11 (11a/11b) | 40°F to 50°F |
| 12 (12a/12b) | 50°F to 60°F |
| 13 (13a/13b) | 60°F to 70°F |
Find your own zone by address on the USDA Plant Hardiness Zone Map if you do not already know it.
Why the zone number won’t hand you a date
A zone number is a single fact about one extreme night; a frost window is a pattern across two full seasons, and several things move that pattern independently of winter cold:
- Elevation. Cold air sinks, so a balcony partway up a slope can sit above the coldest pooled air nearby, while one at the base of a slope or in a low courtyard can collect it.
- Latitude and day length. Two stations with the same winter minimum at different latitudes do not necessarily lose or gain daylight at the same rate through spring and autumn, which shifts when the ground and the air around a balcony actually warm up.
- Local weather patterns that have nothing to do with winter’s coldest night — a foggy river valley, a lake-effect corridor, or a mountain-shadowed dry side of a range can each hold their own frost pattern regardless of zone.
None of that is a reason to ignore your zone. It is the reason a frost-date tool has to measure frost directly, at a real station, rather than being inferred from a zone map.
The tools that actually give you a date
Purdue University and the Midwestern Regional Climate Center publish the most granular public frost-date tool available for a US reader: the Freeze Date Tool reports county-level Earliest, Early (10th percentile), Average, Late (90th percentile), and Latest freeze dates at chosen temperature thresholds of 20°F, 25°F, 28°F, 30°F, 32°F, 35°F, 36°F, and 40°F, built from records running from 1950 through the most recent spring or fall season and updated twice a year. Its coverage is the north-central and northeastern United States only — if your balcony sits there, this is the first place to check, and the percentile columns are worth reading past the average: the “Late” column at your working threshold is closer to a worst-case planning date than the average is.
Outside that coverage area, a local cooperative extension office is the closest thing to ground truth. Extension offices maintain long-run station records for their own counties and can give a working frost range that a national map cannot resolve down to. The USDA’s National Institute of Food and Agriculture maintains a state-by-state directory of Cooperative Extension services if you do not already know your local office.
Gardeners in the UK have their own published reference. The RHS gives regional last-frost windows as ranges rather than single dates: south-west England runs from the first to the second half of May, southern England the second half of May, the Midlands and north-west to the end of May, north-east England and southern Scotland to early June, and the Scottish Highlands to mid-June. The RHS also gives working temperature bands for planting out: night temperatures generally above 7°C, or above 10°C for heat-loving crops such as tomatoes, peppers, basil, and cucurbits; a last air frost sits near or below 0°C; hardening off takes 2 to 3 weeks; and fleece protection buys about 2°C.
Wherever you garden, a national meteorological service or an agricultural extension equivalent is the right first call — most publish station-based averages the same way, even where no single lookup tool exists for the whole country.
How a balcony shifts the regional average
A regional frost figure, from any of the sources above, describes an open-country or standard-station reading. A balcony sits in its own microclimate, and that microclimate can move the real date in either direction.
The RHS’s own regional figures show how large a shift a sheltered or exposed position can produce: a sheltered position moves timing about one to two weeks earlier than the regional window, while an exposed or rural spot delays it one to three weeks. Those numbers were measured for UK gardens rather than balconies specifically, but a week or more in either direction is a realistic swing, not a rounding error.
Pavement, buildings, and heating systems releasing stored warmth overnight, and a balcony set against a heated wall gaining extra shelter from that building’s own heat loss, are the plausible mechanisms behind a sheltered position running warmer than the regional average — worth checking on your own balcony rather than assuming, since neither RHS nor the other extension sources here measured an urban heat-island effect specifically on frost timing. Where it does hold, “slightly ahead” is not “risk-free”: a late cold snap can still reach a sheltered balcony.
Exposure can just as easily work against a balcony instead of for it. A high floor with unbroken wind, a north-facing surface that gets little or no direct winter sun, or a corner where cold air funnels between two buildings can each run colder than street level, even in a city with a strong average heat-island effect. Treating “urban” as automatically “warmer” for a specific railing skips the check that actually matters — which of these applies to your own space — before leaning on a regional date.
Use the date once you have it
A frost date only becomes useful once it drives a decision. If you are sowing seeds indoors ahead of a working last-frost date, the seed-starting calculator is built for exactly that handoff — it takes the date you found here and counts backward to a sowing window by crop. For the rest of the season, from late-winter preparation through the autumn wind-down, the balcony vegetable garden calendar uses the same frost and night-temperature gates, rather than fixed calendar months.
Tender fruiting crops carry the most risk from an early or late guess. If tomatoes are part of the plan, dwarf tomatoes in pots on a small balcony covers the container side of that decision once a safe planting window is set. For a broader starting point across herbs, vegetables, and layout, the small-space herb gardening hub is the place to begin.
Where a frost date gets misused
- Treating a zone number as a planting date. It is a winter cold-tolerance figure, not a spring or autumn timing figure.
- Using an average as if it were a promise. An “average” last frost still has a real chance of a colder-than-average year; the percentile columns on a tool like Purdue’s exist for exactly that reason.
- Applying a rural or regional figure to a sheltered balcony unadjusted. A number built from an open-country weather station is a starting point, not a measurement of a specific railing against a specific wall.
- Ignoring a balcony’s own wind exposure. Height, orientation, and gaps between buildings can push a sheltered-seeming space colder than the regional average, even in a generally warmer city.
- Checking a tool once and treating it as permanent. Extension and climate-center figures are recalculated as new decades of station data come in; a number checked several years ago may not reflect the latest published range.
Sources
Plan the season around a real date
Once you have a working frost date, these guides turn it into a sowing schedule, a season plan, and a crop-by-crop timeline.
Common questions
What is the difference between a USDA hardiness zone and a frost date?
A hardiness zone reports the average annual minimum winter temperature in 5 to 10 degree Fahrenheit bands, based on USDA weather-station data. A frost date is a calendar estimate of when temperatures typically cross 32°F in spring and fall. Two locations in the same zone can have very different frost timing depending on how continental or coastal their climate is.
Where can I find an actual first or last frost date for my area?
Purdue’s Freeze Date Tool gives county-level earliest, average, and latest freeze dates at several temperature thresholds for the north-central and northeastern United States. Outside that region, a local cooperative extension office or a national meteorological service publishes the closest thing to a verified average for a nearby station.
Does living in a city or on a balcony change frost timing?
Often, yes. Urban heat and a building’s stored warmth tend to delay the first fall frost and can allow an earlier last-frost setting-out date than the open-country average, while a wind-exposed, high-rise, or shaded balcony can run colder than street level. Treat a regional average as a starting point, then adjust with your own observations.
Can a hardiness zone tell me when to plant?
Not reliably. The zone number only measures winter cold extremes, not the timing of frost onset or retreat, so a zone number alone will not set a planting date. Use the zone to judge whether a perennial can survive winter outdoors, and use a frost-date tool, extension office, or your own records for planting timing.
Related guides
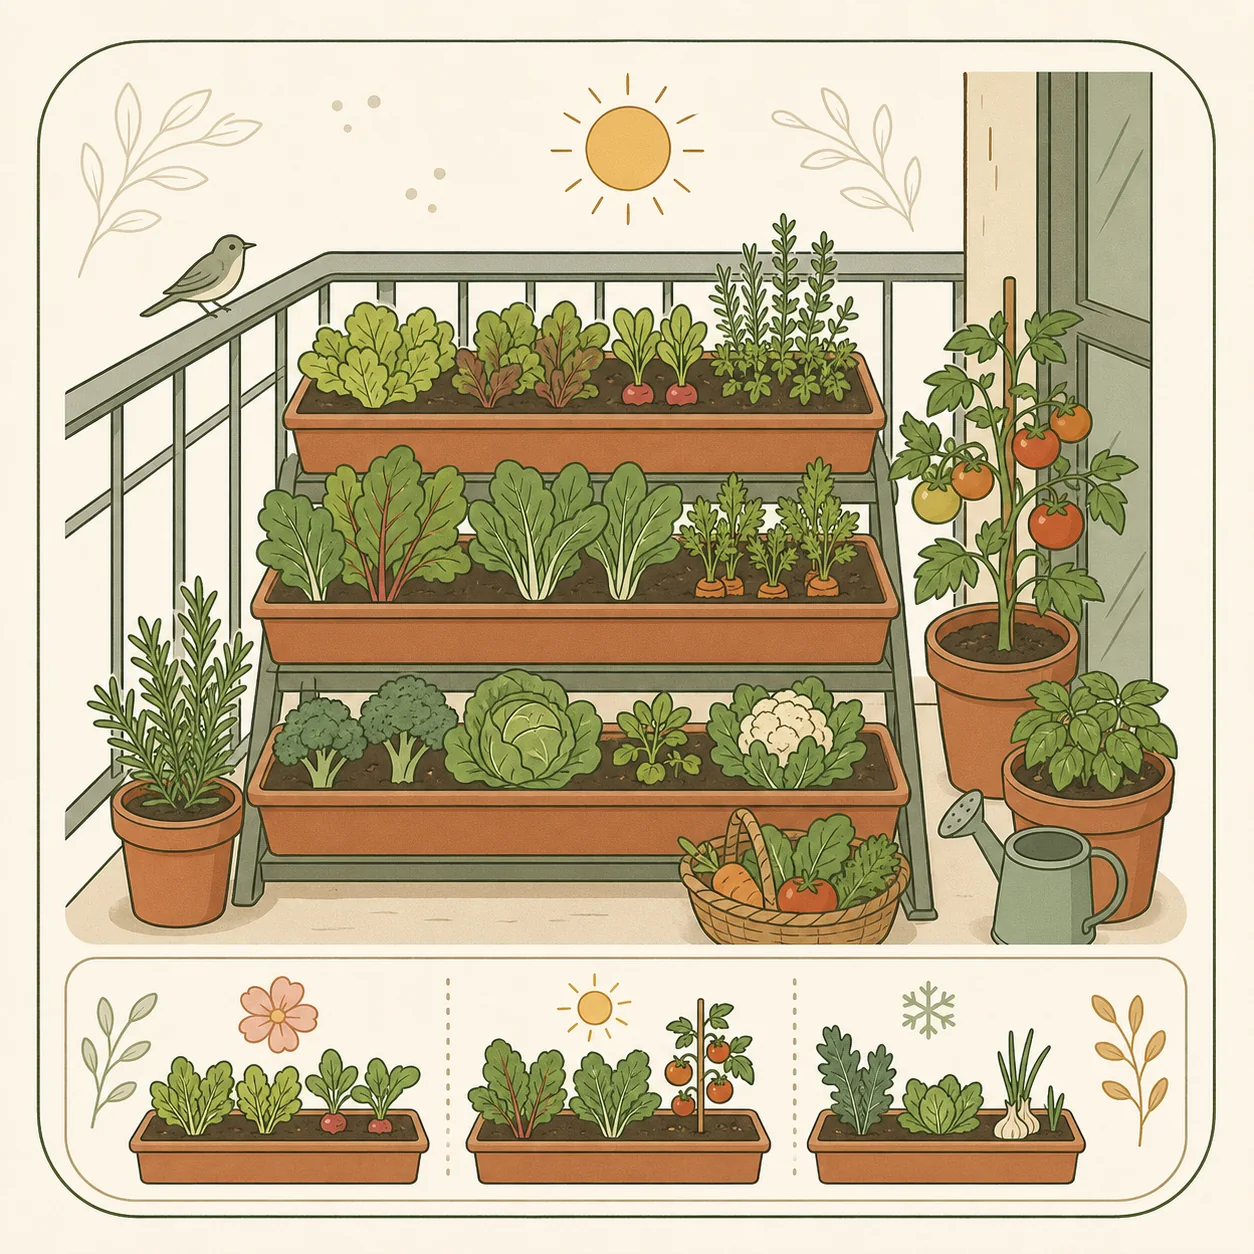
Balcony vegetable garden calendar: what to do each season
A useful balcony calendar is a set of seasonal decisions, not twelve fixed planting lists. Use temperature, light, and container conditions to decide what happens next.
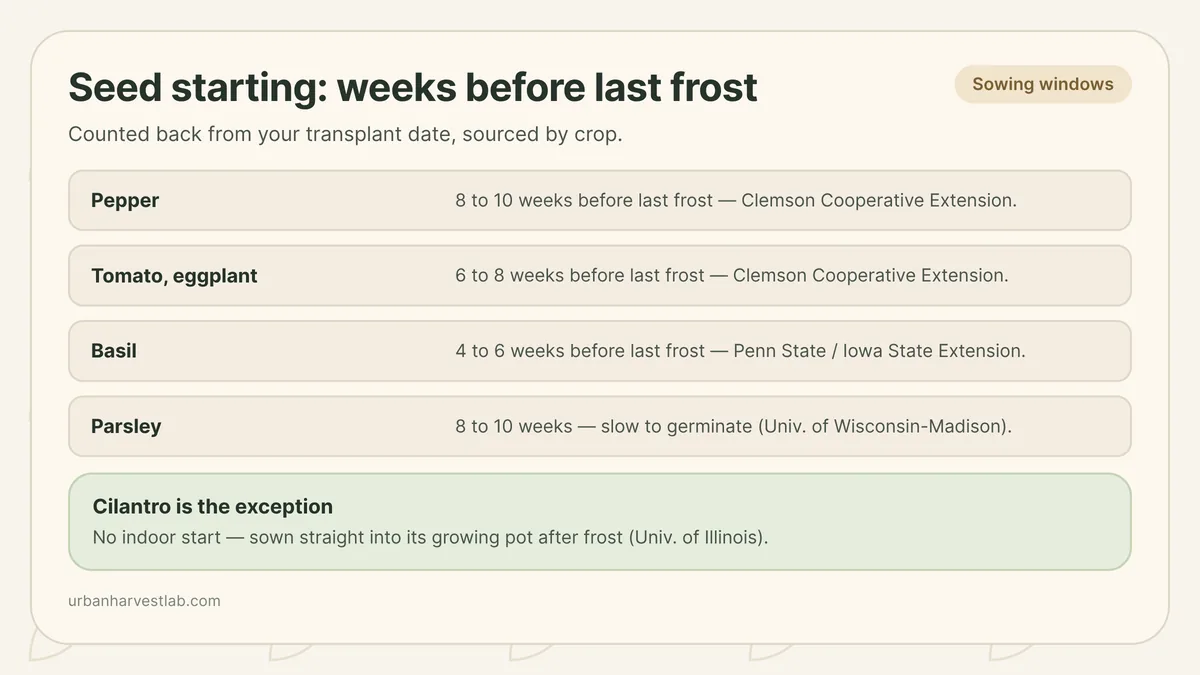
Seed starting calculator: sowing dates from your last frost date
A last frost date is only useful once you count backward from it. This works out that count crop by crop, instead of applying one week figure to everything in the seed drawer.
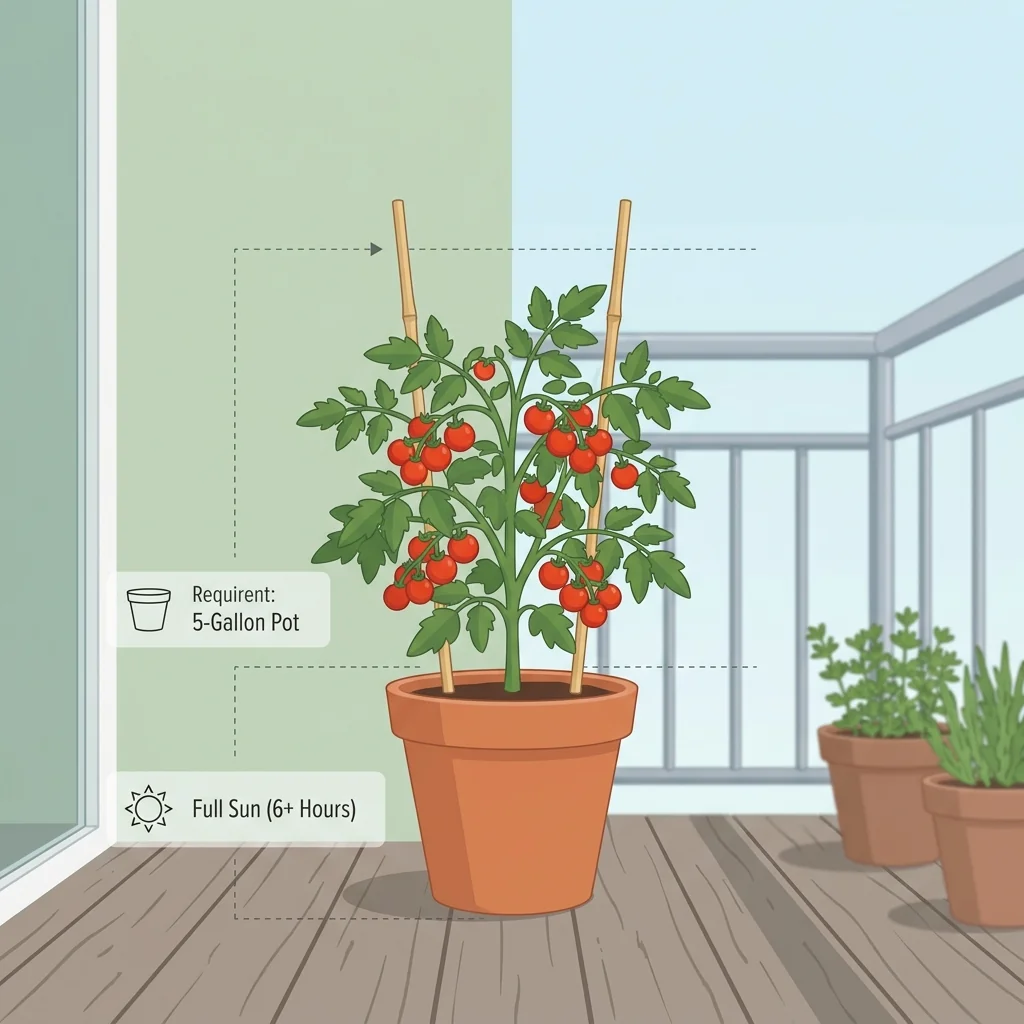
How to grow dwarf tomatoes in pots on a small balcony
Traditional tomato plants grow into massive, untameable 8-foot jungle vines that require giant cages and take over your entire balcony. But with modern 'micro-dwarf' or patio tomato varieties, you can grow heavy yields of sweet cherry tomatoes on a plant that stays under 2 feet tall. Here is the dwarf tomato container blueprint.