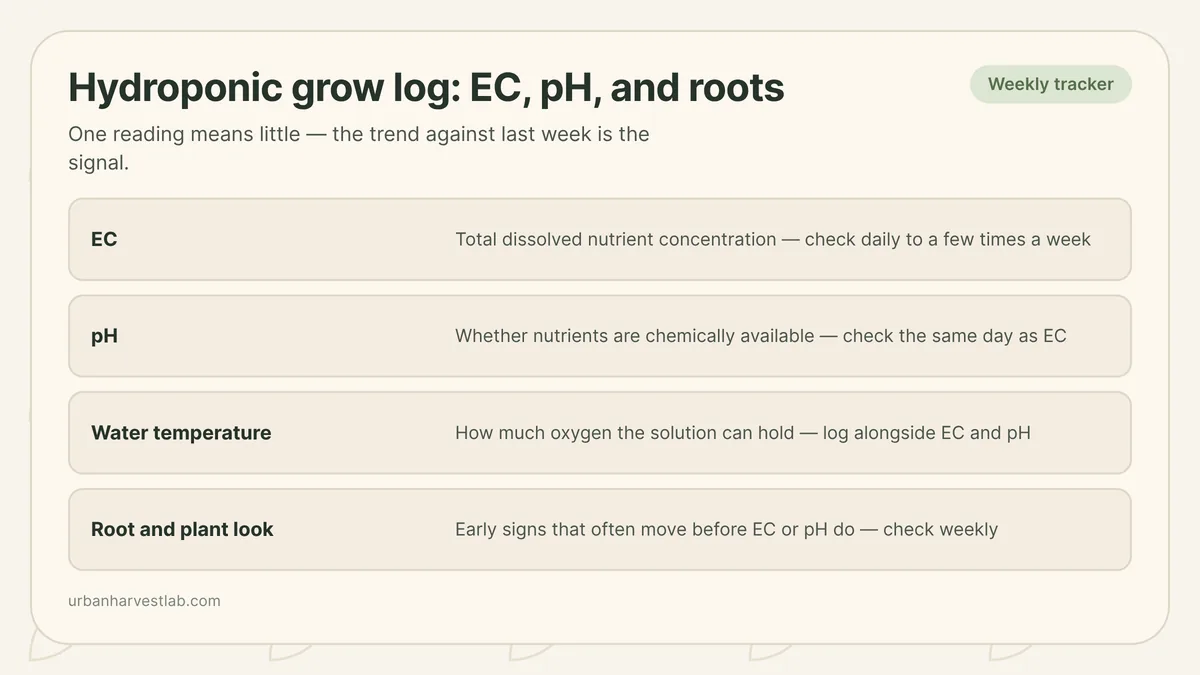
A hydroponic grow log is a weekly record of EC, pH, water temperature, reservoir level, and how the plants and roots actually look — and its value comes entirely from comparing this week’s entry to the last one, not from any single reading. One EC number tells you where the solution sits right now. Ten EC numbers, one a week, tell you whether it is climbing, falling, or holding steady, which is the actual question behind most hydroponic troubleshooting. The tracker below saves each entry in your browser so you can build that record without a spreadsheet.
If you have not settled on what EC and pH mean for your system yet, hydroponic nutrient basics is the framework to read first. The tracker below assumes you already have a meter and are ready to start recording what it shows.
What to write down every week
Five things are worth a column of their own, and each one is answering a different question.
| What to log | What it actually tells you | How often the sources suggest |
|---|---|---|
| EC (electrical conductivity) | Total dissolved nutrient concentration, as a proxy — not which individual nutrient is high or low | Daily to a few times a week |
| pH | Whether the nutrients already in solution are chemically available to the roots | Same day as EC, checked after EC is adjusted |
| Water/reservoir temperature | How much dissolved oxygen the solution can hold, and how fast bacteria and algae can grow in it | Alongside EC and pH |
| Reservoir level and top-ups | How much water evaporated or was transpired, and whether what you added matched the label concentration | Every top-up |
| Root and plant appearance | Early physical signs — root colour, biofilm, leaf tipburn — that often move before EC or pH explain them | Weekly visual check |
Meters report EC in one of two families of units: mS/cm (equivalently µS/cm or dS/m) or ppm, and the two are not a single fixed conversion. UF/IFAS Extension’s own figures for lettuce imply about 467 ppm per mS/cm, while hobby meters commonly use a 500 or 700 scale instead — so three different meters can show three different ppm numbers for the same solution. Record the mS/cm figure in the log every week rather than ppm; if your meter only reads in ppm, the EC to ppm converter converts a single reading, but it will not fix a log column that mixes scales week to week.
The monitoring cadence genuinely differs by source, and the difference is about system type, not disagreement over the science. Oklahoma State University Extension recommends checking pH and EC daily, at the same time of day, checking pH only after EC is dialled in. Virginia Cooperative Extension gives two to three checks a week for a deep water culture system. University of Minnesota Extension recommends checking the source water’s own pH and EC weekly, and again every time you top off, and adds that in a small passive container pH is unlikely to shift substantially, so checking every few weeks is reasonable there. None of that is a contradiction — a running NFT system with a small reservoir volume relative to its plants drifts faster than a five-gallon bucket growing one head of lettuce, so it earns the more frequent check.
Whatever schedule you land on, keep it fixed. A log entered at 9am on a cool morning and 6pm on a warm afternoon mixes two different measurements together and makes the trend harder to read than no log at all.
Track your grow
Your log
Enter this week's readings, save the entry, and the summary on the right compares it with your last saved check. Everything is stored in this browser only — nothing is uploaded.
Since your last saved check
—
- Last EC
- —
- Last pH
- —
- Last water temp
- —
Save your first weekly check below to start comparing readings over time.
Save, export or print
Saving keeps a running record in this browser, on this device. Export it as a CSV file or print it if you want a copy that survives a cleared cache.
No entries logged yet.
| Date | EC | pH | Water temp | Reservoir | Added | Look | Notes |
|---|
If the widget will not load, the same record works on paper: rule seven columns for date, EC, pH, water temperature, reservoir action, plant/root look, and notes, and fill one row a week. The comparison that matters is entirely manual — read this week’s EC against last week’s and note whether it moved and by how much.
Why the trend matters more than the number
EC falls as plants take nutrients up and rises as evaporation and transpiration remove water from the reservoir, which is why the same meter reading can mean two opposite things depending on which direction it came from. Cornell University’s CEA program is explicit that a grower should raise EC with concentrated stock solution when it has fallen, and dilute with plain water when it has risen — and that the base EC of your own source water should be subtracted from every reading before you compare it to a target, since a reading of “1.5” means something different starting from tap water at 0.3 than from reverse-osmosis water at 0. Hydroponic EC rising or falling walks through what each direction usually means once you have a few logged entries to compare.
pH drifts for different reasons than EC does, and it is worth tracking separately rather than assuming the two move together. University of Missouri Extension notes that alkalinity — the water’s capacity to neutralise acid, measured separately from pH itself — is usually why pH creeps back up after you correct it, and that high pH does not automatically mean high alkalinity or vice versa. Tap water alkalinity covers why a solution you corrected yesterday can be back above target today, and why pH keeps rising works through the common causes once your log shows a repeating pattern rather than a one-off blip.
A meter is only as good as its calibration. Missouri recommends calibrating a pH probe weekly at two points, pH 4 and pH 7, and notes that a pH probe typically lasts one to two years while an EC probe lasts two to five. If a logged reading looks implausible against the trend, check the calibration before you trust the number — choosing and calibrating an EC or pH meter covers that routine in more depth.
Water temperature belongs in the same log, not a separate one
Warmer nutrient solution holds less dissolved oxygen, and that relationship is measurable rather than a cliff edge. U.S. Geological Survey solubility tables put saturated fresh water at 18 °C (64 °F) at 9.4 mg/L of oxygen and at 27 °C (81 °F) at 7.9 mg/L — a real loss of about 16%, but still comfortably above the roughly 4 ppm minimum Cornell gives for satisfactory lettuce growth and close to the 6 to 8 ppm range University of Kentucky Cooperative Extension gives for deep water culture. The risk of warm water is not that oxygen disappears at some threshold; it is that a warm, stagnant reservoir lets bacteria and water moulds multiply faster than an aerated one can keep up with, and warm, wet conditions are the window University of Kentucky Cooperative Extension gives for bacterial soft rot (above 77 °F) and bottom rot (77-95 °F) — though Kentucky also puts Botrytis and powdery mildew in cool windows, so temperature alone does not predict which disease you get.
The extension sources in this space do not agree on one ideal water temperature, and a log is more useful than any single target number here. Oklahoma State University Extension calls 72 to 75 °F (22 to 24 °C) optimal. UF/IFAS Extension gives a wider 65 to 80 °F (18 to 27 °C) for small home systems. Cornell’s commercial pond lettuce runs up to 25 °C (77 °F) with active cooling above that. What all three agree on is the direction that matters for a log: if the temperature column is climbing at the same time as an algae note or a root-colour note appears, that is the pattern worth acting on, more than any single degree. Root rot prevention covers what a warm, low-oxygen reservoir actually does to roots once it gets there.
Reservoir level and top-ups are part of the EC story
A reservoir level that keeps dropping between checks is telling you how fast plants are transpiring and how fast water is evaporating — and how you refill it changes what your next EC reading means. University of Minnesota Extension’s rule for topping up is simple: whatever concentration is on the fertilizer label, every litre you add back in should carry that same concentration, and pH should be checked again after any top-up. A reservoir topped up with plain water dilutes EC even if the label-strength solution stays untouched; topped up with fresh nutrient solution, EC should hold closer to steady. Logging which one you did is what makes next week’s EC reading interpretable instead of a mystery number.
Full reservoir changes are a different event from a top-up, and the sources disagree on interval by crop cycle length rather than by opinion. Oklahoma State University Extension recommends a complete change every two weeks. University of Kentucky Cooperative Extension gives three to four weeks, with the reservoir topped up every few days in between to replace lost volume. University of Minnesota Extension notes that fast-maturing leafy greens like lettuce, harvested in six to seven weeks, rarely need a full change-out at all, while longer-maturing crops such as tomatoes typically need one or two over a season. When to change your nutrient solution covers the top-off-versus-full-reset routine in more depth, but the log entry itself is what tells you how long it has actually been since the last one — a question that is easy to misremember by a week or two.
Catching a problem before the plant shows it
The reason a notes field sits next to the numbers is that plant and root symptoms often move first. A root that has gone from white to grey-brown, or a reservoir with a green film building along the waterline, is worth writing down even the week EC and pH both look fine — Cornell University’s CEA program treats algae control as a light problem first, keeping solution tanks, input and output pipes and other wet equipment shaded, because algae flourish in wet, well-lit places well before they clog a pump intake or stress a crop directly. University of Minnesota Extension adds that over-fertilisation itself promotes algae growth and that a heavy bloom eventually clogs tubing and plugs pump intakes, so by the time algae are visibly a problem, over-fertilisation or excess light has usually been building for a while. If the reservoir needs a full clean rather than a top-up, cleaning a small hydroponic system covers the sanitising step separately from the weekly log.
The same logic applies to slow growth. A single week where lettuce looks smaller than expected is not a trend — it is one data point, and a log’s real job is separating that from a genuine multi-week bottleneck. If hydroponic lettuce is growing slowly, the useful move is checking light, spacing, and root health in order before touching EC at all, and having several weeks of logged readings already on hand is what makes that diagnosis fast instead of guesswork. A grower who only remembers “it’s been a bit off lately” is working from a much weaker signal than one who can see that EC has crept up for three straight weeks while the reservoir kept needing plain-water top-ups.
Sources
- Oklahoma State University Extension, Electrical Conductivity and pH Guide for Hydroponics (Dunn & Singh, 2017) — daily EC/pH monitoring, meter calibration and cost, and nutrient-solution temperature.
- Cornell University CEA Program, Hydroponic Lettuce Handbook — EC drift mechanics, dissolved-oxygen set points, and water temperature limits for pond lettuce.
- University of Minnesota Extension, Small-scale hydroponics — top-up concentration rule, reservoir change-out frequency by crop, and algae and biofilm control.
- University of Kentucky Center for Crop Diversification, Hydroponic Lettuce Production in Controlled Environments — solution replacement interval and dissolved-oxygen range for deep water culture.
- University of Missouri Extension G6984, Hydroponic Nutrient Solutions — meter calibration schedule and probe lifespan, and alkalinity versus pH.
- USGS Techniques of Water-Resources Investigations, Dissolved Oxygen solubility tables — oxygen solubility by water temperature.
Build the diagnostic habit around your log
The log is only useful once you know what a rising or falling reading means, and when a reading is telling you to change the whole reservoir.
Common questions
How often should I actually log EC and pH?
Oklahoma State University Extension recommends checking both daily, checking pH only after EC is in range. Virginia Cooperative Extension gives two to three times a week for a deep water culture system, and University of Minnesota Extension says weekly is enough for a small passive container, checked again whenever you top off. Pick a fixed schedule you will actually keep rather than the most frequent one on paper.
What counts as a normal EC change from one week to the next?
University of Minnesota Extension says EC tolerance falls as plants mature, so a system can start at a higher EC but should have that target brought down as the crop grows — excess nutrients at that stage impair water uptake and cause wilting and stunted growth, while an EC that is too low signals reduced growth or deficiency. Within that downward trend, there is no single normal week-to-week number, because the size of a healthy drift still depends on plant size, reservoir volume, and evaporation between checks. What matters is the direction and the size of the jump relative to your own last few entries: a small, steady drift is expected, while a sudden large jump in either direction is the signal worth investigating.
Do I need to write down every plant symptom, or just the readings?
Write down both. Root colour, algae in the reservoir, and leaf changes often show up a week or two before EC or pH move enough to explain them on their own, so a notes field next to the numbers is what turns a log into an actual diagnostic tool.
Is a saved browser log enough, or should I keep a paper backup?
The browser-based grow log tracker saves to your browser only, on the device you used to enter it, so exporting a CSV file periodically or printing a copy is worth doing if you want the record to survive a cleared cache or a new device.
Related guides
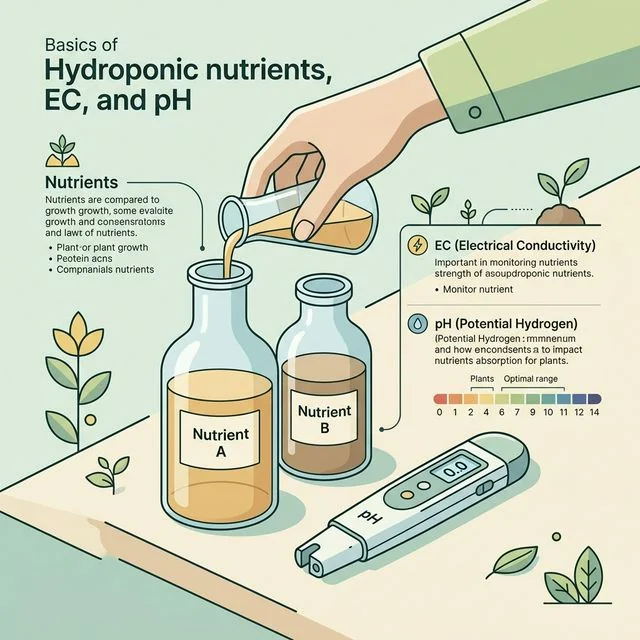
Hydroponic nutrient basics: EC, pH, dilution, and reservoir stability
Most hydroponic problems are not mysterious. They come from concentration drift, pH drift, heat, or neglected maintenance. This guide covers the basics clearly.
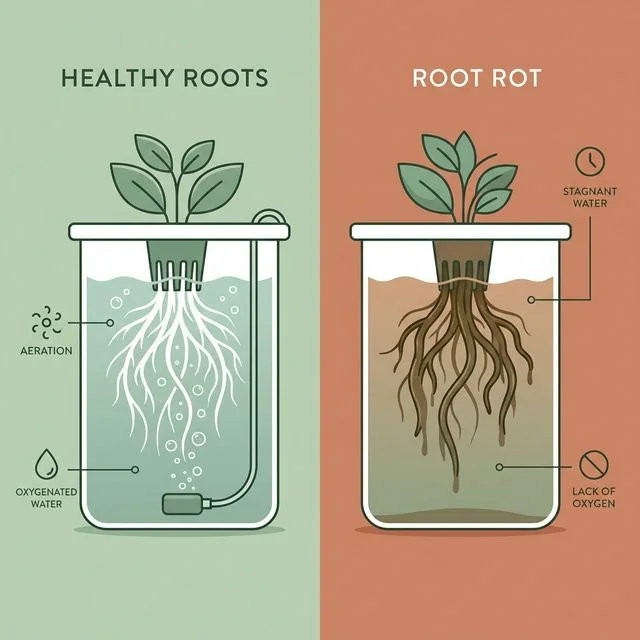
Hydroponic root rot: how to spot it early and stop it
Brown, slimy or swampy-smelling roots mean root rot. Catch it early and fix the conditions behind it — warm water, low oxygen and stagnant flow.
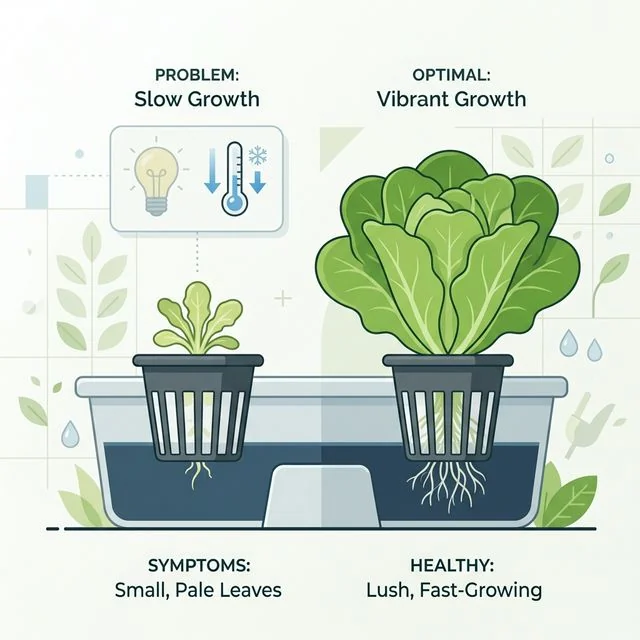
Hydroponic lettuce growing slowly? Check light, roots, and EC in order
Slow hydroponic lettuce is usually a systems problem, not a mystery deficiency. The goal is to find the bottleneck without overcorrecting five variables at once.